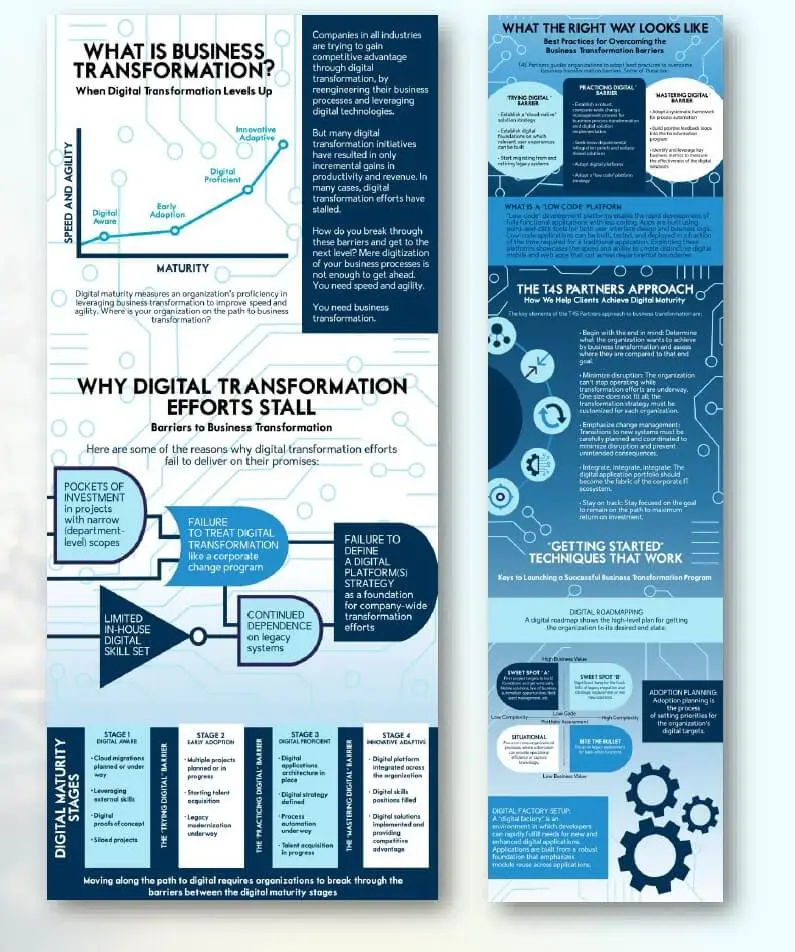
Our collaboration with an agency partner led us to support a client specializing in IT transformation services. This client, a leader in providing advisory, implementation, and managed support services, sought to enhance its communication through visually compelling infographics.
Our collaboration with an agency partner led us to support a client specializing in IT transformation services. This client, a leader in providing advisory, implementation, and managed support services, sought to enhance its communication through visually compelling infographics.
- Complex subject matter requiring precision-engineered visuals
- Extensive resource libraries that needed in-depth review
- Development of visuals accessible to a diverse global audience
Our work was built on a three-step framework intended to efficiently extract and redefine insights hidden in the client’s marketing material:
- Review material to form a deep understanding of the data available;
- Perform structured reorganization for clarity and efficiency;
- Create visual breakdowns of organized data to illuminate key messaging in the client’s marketing outreach.
Material Review
We began by reviewing the vast library of materials provided by the client. This phase involved detailed analysis and review to understand the scope and depth of the content, allowing us to identify themes, patterns, and valuable data points. This established a strong foundation for next steps and ensured that no critical information was overlooked.
Data Organization
With assessments in hand, we began organizing pertinent details into a structured format. This process involved categorizing data and insights into coherent talking points that logically flowed from one to the next. Our goal was to create a narrative for each visual that was logical and engaging, preparing raw data for transformation into a persuasive, engaging visual.
Design & Presentation
Our designers translated the organized data into high-impact infographics crafted to illustrate key concepts while aligning with the client’s aesthetic and branding goals. We leveraged visual design elements, typography, and strategic spatial arrangements to ensure each infographic wasn’t just packed with data, but readable and accessible to audiences. Today, these infographics serve as powerful tools for communicating complex data points in a simple, shareable way.

Contact Us
Questions bring clarity to life. Achieve clarity, contact us today to learn more about how we can help.


